Year 4 Multiplication Tables Check 2026: Key info and insights
What is a good MTC score? Scores from 2025 and insights into which are the hardest times tables: our MTC 2026 guide has it all.

This guide is updated annually with the latest MTC data. Last updated: January 2026.
In this blog, we take a close look at what the Year 4 Multiplication Times Table Check means for primary teachers and provide some valuable insights to help you prepare your pupils for the tests to come.
Your Year 4 MTCs 2026 guide: what you’ll find
When is the Year 4 Multiplication Times Table Check 2026?
What is the Multiplication Times Table Check?
How will the Year 4 Multiplication Times Table Check be used?
What is the ‘pass mark’ for the Multiplication Times Table Check (MTC for year 4)?
How did year 4 pupils perform nationally on the 2025 Multiplication Times Table Check?
What is a ‘good’ score on the MTC?
Which times table questions are the hardest for this cohort?
Most challenging times tables facts resource for the 2026 cohort
Using Learning by Questions to support MTCs in 2026
When is the Year 4 Multiplication Times Table Check 2026?
Within the 2-week period starting Monday 1st June and ending Friday 12th June. The multiplication times table checks are undertaken by all eligible year 4 pupils.
More information on the multiplication times tables check can be found at the gov.uk website.
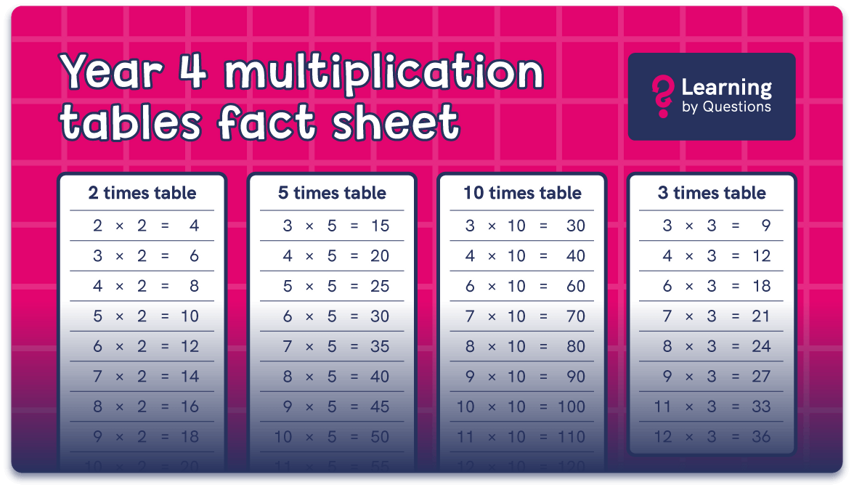
Multiplication tables fact sheet
Download your free copy of our Multiplication Tables Check Fact Sheet that also highlights the toughest times tables for the 25/26 cohort.
Your download should open automatically, but if not, you can open the file manually. Be sure to join our mailing list for more insightful content.
What is the Multiplication Times Table Check?
The Multiplication Times Table Check (MTC) is a statutory test for all year 4 pupils in England. The purpose of the Multiplication Times Table Check is to determine whether pupils can fluently recall their times tables up to 12 x 12.
Pupils are tested on their ability to answer 25 multiplication questions online. They have six seconds to answer each question, and schools are given a two-week window to ‘check’ all eligible children in the year group.

How will the Year 4 Multiplication Times Table Check be used?
The data from the times tables checks is:
- used by schools to “provide additional support to pupils who require it.”
- available to Ofsted via the Analyse School Performance (ASP) data system.
- reported on by the Department for Education (DfE) to track standards over time.
- used by the DfE to provide schools with the ability to benchmark the performance of their pupils.
What is the ‘pass mark’ for the Multiplication Times Table Check (MTC for year 4)?
Perhaps reassuringly, there is no official ‘pass mark’ for the Multiplication Times Table Check. Even better, the data isn’t published in performance tables. It’s all a simple way for schools and other educational authorities to see how pupils are doing within this key area of maths so that ‘additional support can be provided’.
This all makes great sense. However, there is a small caveat: school-level results are available to “selected users including Ofsted” for standards benchmarking. Results are also published at national and local authority level. Which all means that there is inevitably still pressure on schools, teachers and ultimately pupils to make sure that a school’s results are in line with (or better than) local and national averages.
Related content
10 practice activities ahead of the Year 4 Multiplication Tables Checks
How did year 4 pupils perform nationally on the 2025 Multiplication Times Table Check?
37% of all pupils scored 25, with 25 also being the most common score according to the DfE. This is an increase of 3 percentage points compared to 2024. The mean score was 21 out of 25.
Average attainment score 2025 | Average attainment score 2024 | Percentage difference | |
|---|---|---|---|
Nationally | 21 | 20.6 | +0.4* |
Disadvantaged pupils | 19.3 | 18.9 | +0.4 |
Non-disadvantaged pupils | 21.7 | 21.3 | +0.4 |
*The government reports that the increase is 0.3 points (based on unrounded figures)
The above shows the attainment gap between disadvantaged and non-disadvantaged pupils remains.
London was the highest performing region in 2025 with an average score of 21.7.
Beyond London, the North East and the West Midlands were the best performing regions with an average score of 21.2.

What is a 'good' score on the MTC?
The official benchmark is that a score of 25 out of 25 demonstrates ‘fluency’ in multiplication tables up to 12x12.
What’s the national average?
A more practical yardstick of a good score on the MTC is the national average.
- For 2025, the national average score was 21 out of 25.
- In 2024, the average was 20.6 out of 25.
A score at or above this national average could be generally viewed as a good indication that a child is on track with their times tables learning alongside their peers.

What is the point of the MTC?
Despite the above, the most important perspective here is that this is a measurement not a target. The primary purpose of the check is diagnostic, not punitive.
- For teachers and schools: The results help identify which pupils may need additional support and which multiplication facts a whole class may be struggling with, allowing for targeted teaching.
- For parents and pupils: The score is a single snapshot of a child's recall under timed conditions. It should be viewed as a starting point for further practice, not a final judgment. A score below the national average is a signal for encouragement and focused help, not for concern.
The ultimate goal is not the test score itself, but ensuring children build confident, quick recall of multiplication facts that will support their long-term success in mathematics.
Which times tables are the hardest for this cohort?
The following table shows the top 10 multiplication facts that pupils in the 25/26 cohort are struggling the most with. The data is based on over 4,000 pupils practising their times tables in December 2025 and January 2026.
2025/26 toughest times tables facts | 2024/25 toughest times tables facts | ||
|---|---|---|---|
Times table fact | Percentage of answers correct first time | Times table fact | Percentage of answers correct first time |
6 x 12 | 89.4 | 8 x 12 | 84.8 |
9 x 4 | 89.1 | 8 x 4 | 84.6 |
8 x 9 | 88.4 | 8 x 8 | 84.5 |
7 x 8 | 87.7 | 9 x 7 | 84.1 |
12 x 7 | 87.3 | 7 x 6 | 83.9 |
6 x 9 | 87.2 | 7 x 7 | 83.1 |
6 x 8 | 87 | 6 x 8 | 83.1 |
11 x 11 | 85.3 | 7 x 8 | 83 |
9 x 7 | 85.2 | 9 x 6 | 82.5 |
11 x 12 | 83.9 | 11 x 12 | 81.5 |
NB: A small disclaimer: It’s important to note that the time allowed to complete these Question Sets on LbQ may have been longer than the 6 seconds per question that pupils are allowed during the actual MTC. This would have depended on the decision making of the individual teachers.
The majority of the most challenging questions from the analysis come from the 6, 7, 8, 9 and 12 times tables, and many of these are the facts that are also more likely to appear due to the test parameters.
As a team, we crunch the numbers to see which times tables pupils are struggling with the most. Year-to-year, there might be a couple of top ten changes, but nothing hugely significant. This year, there’s also been quite a significant change in which times tables this cohort finds difficult compared to last year. From the comparison shown on the table above, we can see that some of last year's ‘most challenging’ facts have seen a substantial improvement. This has resulted in a much closer distribution of scores, with more pupils being successful with more facts compared to last year. This has led to the changes seen in the top 10 this year.
11 x 12 maintains the coveted title of ‘most challenging’ fact for the 3rd year in a row according to our data, even though there was also a good improvement for that particular fact.

As a result of this analysis, the team at Learning by Questions have compiled a unique online resource to really focus on the questions which are most likely to need extra practice:
Most challenging times tables facts resource for the 2026 cohort
MTC: Most challenging times tables facts (Jan 2026)
Using Learning by Questions to support MTCs in 2026
LbQ’s Year 4 Multiplication Times Table Check resources can help your pupils get used to the format of the checks themselves. You can use them to:
- Practise using an online platform: The Multiplication Times Table Checks are delivered on-screen (using a computer or tablet) and online (using an internet connection). LbQ's Multiplication Table Check resources can give you and your pupils the experience of testing digitally, whilst gaining immediate information into your pupils' strengths and weaknesses.
- Time your pupils: LbQ resources allow you to limit the time that students have to complete a particular set of questions, which means that you can assess the pace at which your pupils are able to answer times tables. As pupil progression increases, teachers can reduce the time allowed for completion to try and replicate the pace required for the actual Multiplication Times Table Checks.
You can also help boost your pupils' conceptual understanding using any of our practice times tables resources, which include pictorial representations in level 1.
Access a library of Multiplication Tables Check resources alongside a wealth of KS2 mastery and practice materials, absolutely free, with a no-obligation trial.
Find out more: How can LbQ help your pupils progress with maths?